Summary
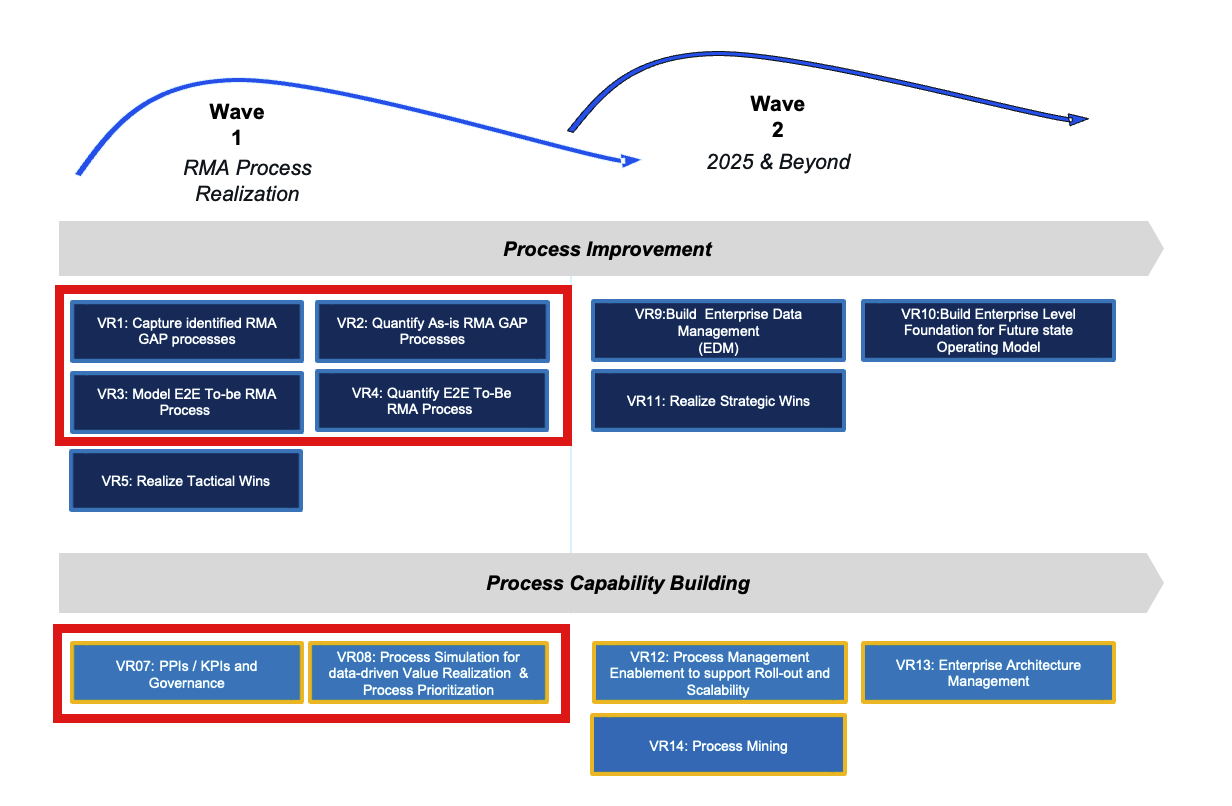
A leading B2B robotics manufacturing company identified the need to enhance its Supply Chain Management (SCM) practices by adopting a process-centric and data-driven approach. The existing processes were static and thus were not conducive to data-driven decision-making. To address this challenge, Scheer Americas led a rapid process improvement initiative (RPI), developing a strategic roadmap for achieving the desired future state of operations.
Organization Background
The organization is a prominent player in the manufacturing sector, specializing in the design, production, testing, and deployment of robots for warehouse operations. Operating in the B2B domain, their focus lies in crafting high-performance autonomous systems aimed at enhancing the customer experience.
Business Challenges and Opportunities
Silos between business and IT functions resulted in disjointed technology implementations, causing operational inefficien�cies within the supply chain. Patch fixes intended to resolve issues often created new challenges, hindering the deploy�ment of IT enhancements. Recognizing the need for an end-to-end view and unbiased, data-driven prioritization within Business Challenge & Opportunity the SCM domain, the organization embarked on a journey to revamp its processes.Scheer Americas facilitated the creation of a value chain and the documentation of existing processes, identifying pain points and proposing data-backed improve�ment and automation initiatives to align with forthcoming ERP enhancements.
Solution
Responding to the identified business challenges and opportunities, Scheer Americas implemented a multifaceted strategy within an 8-week period through Rapid Process Improvement (RPI). The strategy involved leveraging existing resources and a parallel process documentation effort, ensuring efficient use of expert time.
To achieve a precise portrayal of extant operations, Scheer Americas conducted a thorough As-is process capture sessions with the expertise of subject matter experts (SMEs). This effort led to the identification and categorization of 26 key processes in Supply Chain Management (SCM), focusing especially on integration with the Enterprise Resource Planning (ERP) system.
These processes were detailed in schematics developed during live, remote, and on-site sessions, which included role definition, IT system integrations, and data requisites. These processes were validated extensively to ensure accuracy and comprehensiveness.
The insights from SMEs facilitated both qualitative and quantitative evaluations, identifying improvement opportunities. These insights were synthesized into a roadmap outlining tactical and strategic actions crucial for achieving the desired future state. To-be process models were designed, integrating prospects for automation and seamless integration, all of which underwent scrutiny and validation by both SMEs and pertinent IT stakeholders.
Results
The project yielded significant outcomes:
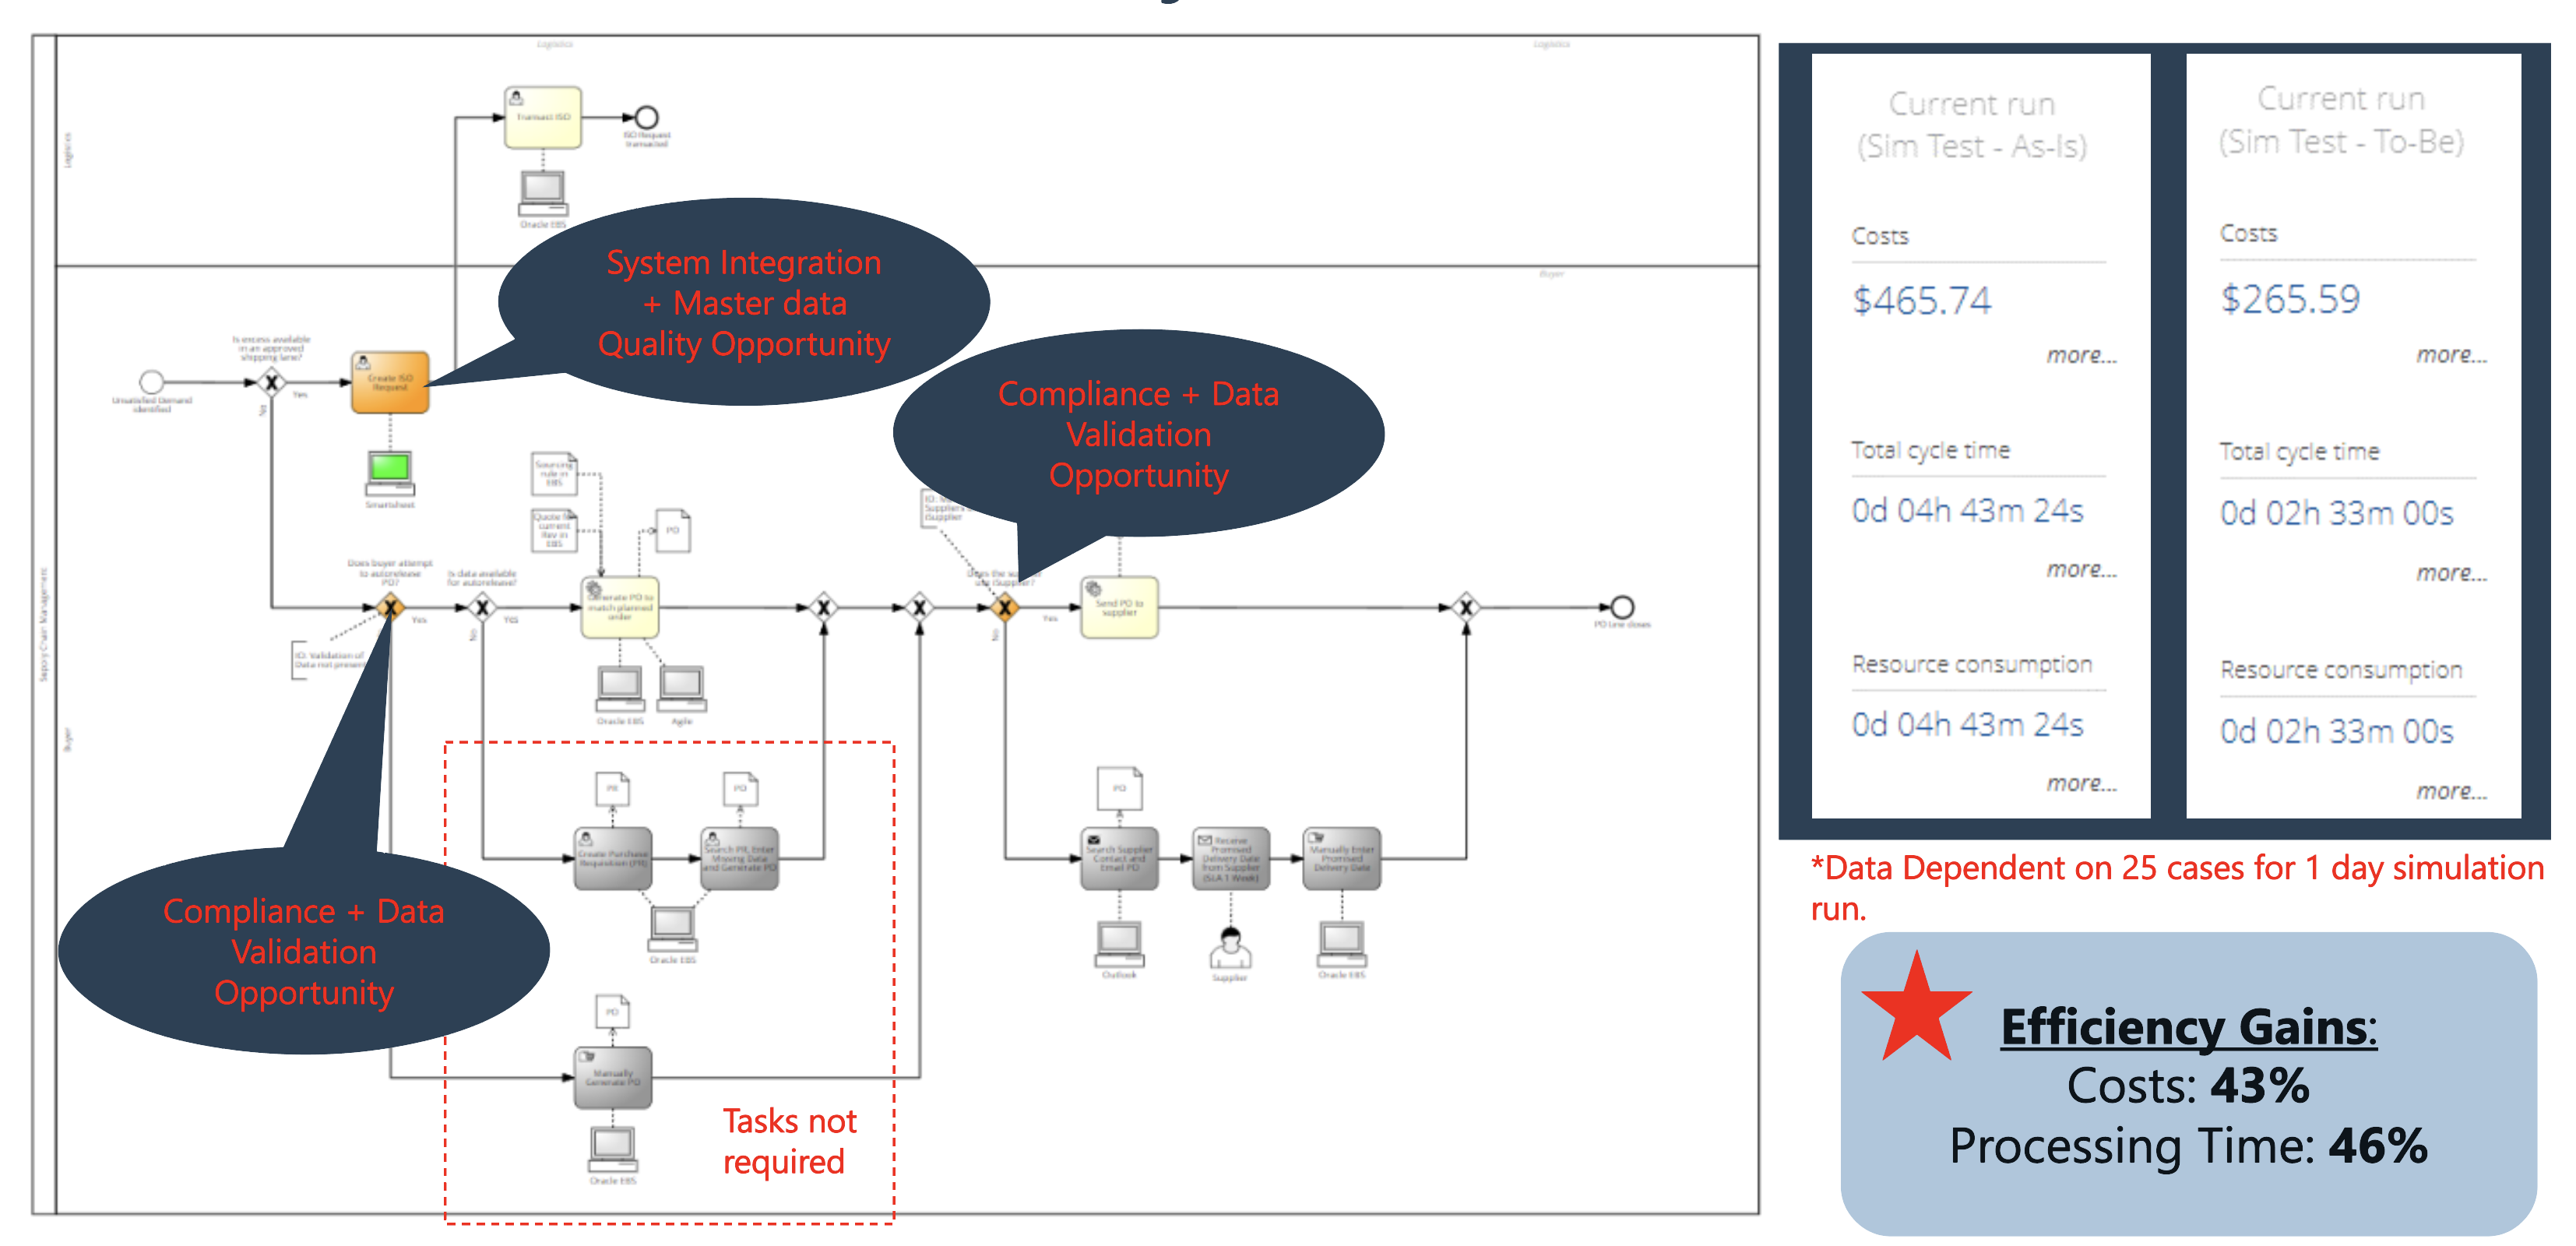
- A pragmatic approach identified the potential for a 31% reduction in manual/user effort and a 43% decrease in the utilization of SCM-related IT applications, thereby streamlining operational efficiency.
- Establishment of an SCM operating model enhanced cross-functional transparency and visibility, fostering improved decision-making processes.
- Comprehensive documentation of 26 As-Is processes, securely stored within a dynamic cloud-based repository, facilitated seamless organizational collaboration and knowledge sharing.
- Documentation of best practices in process modeling and management provided a valuable resource for future initiatives, ensur�ing continuity and efficiency in subsequent projects.
- Quantification of pain points and improvement opportunities at the process/activity level enabled data-driven prioritization, maximizing the impact of strategic interventions.
- Key stakeholders were equipped with the tools and knowledge to maintain business process management discipline, fostering a culture of continuous improvement and sustained organizational growth.

Figure 1: Tactical Opportunities

Figure 2: PO Creation Quantitative Analysis Simulation (As-Is versus. To-Be)